
Expected Points is the analytical core of sports today. It allows you to speak in a common language across all situations, conveying contextual information concisely in the format of what actually matters: points.
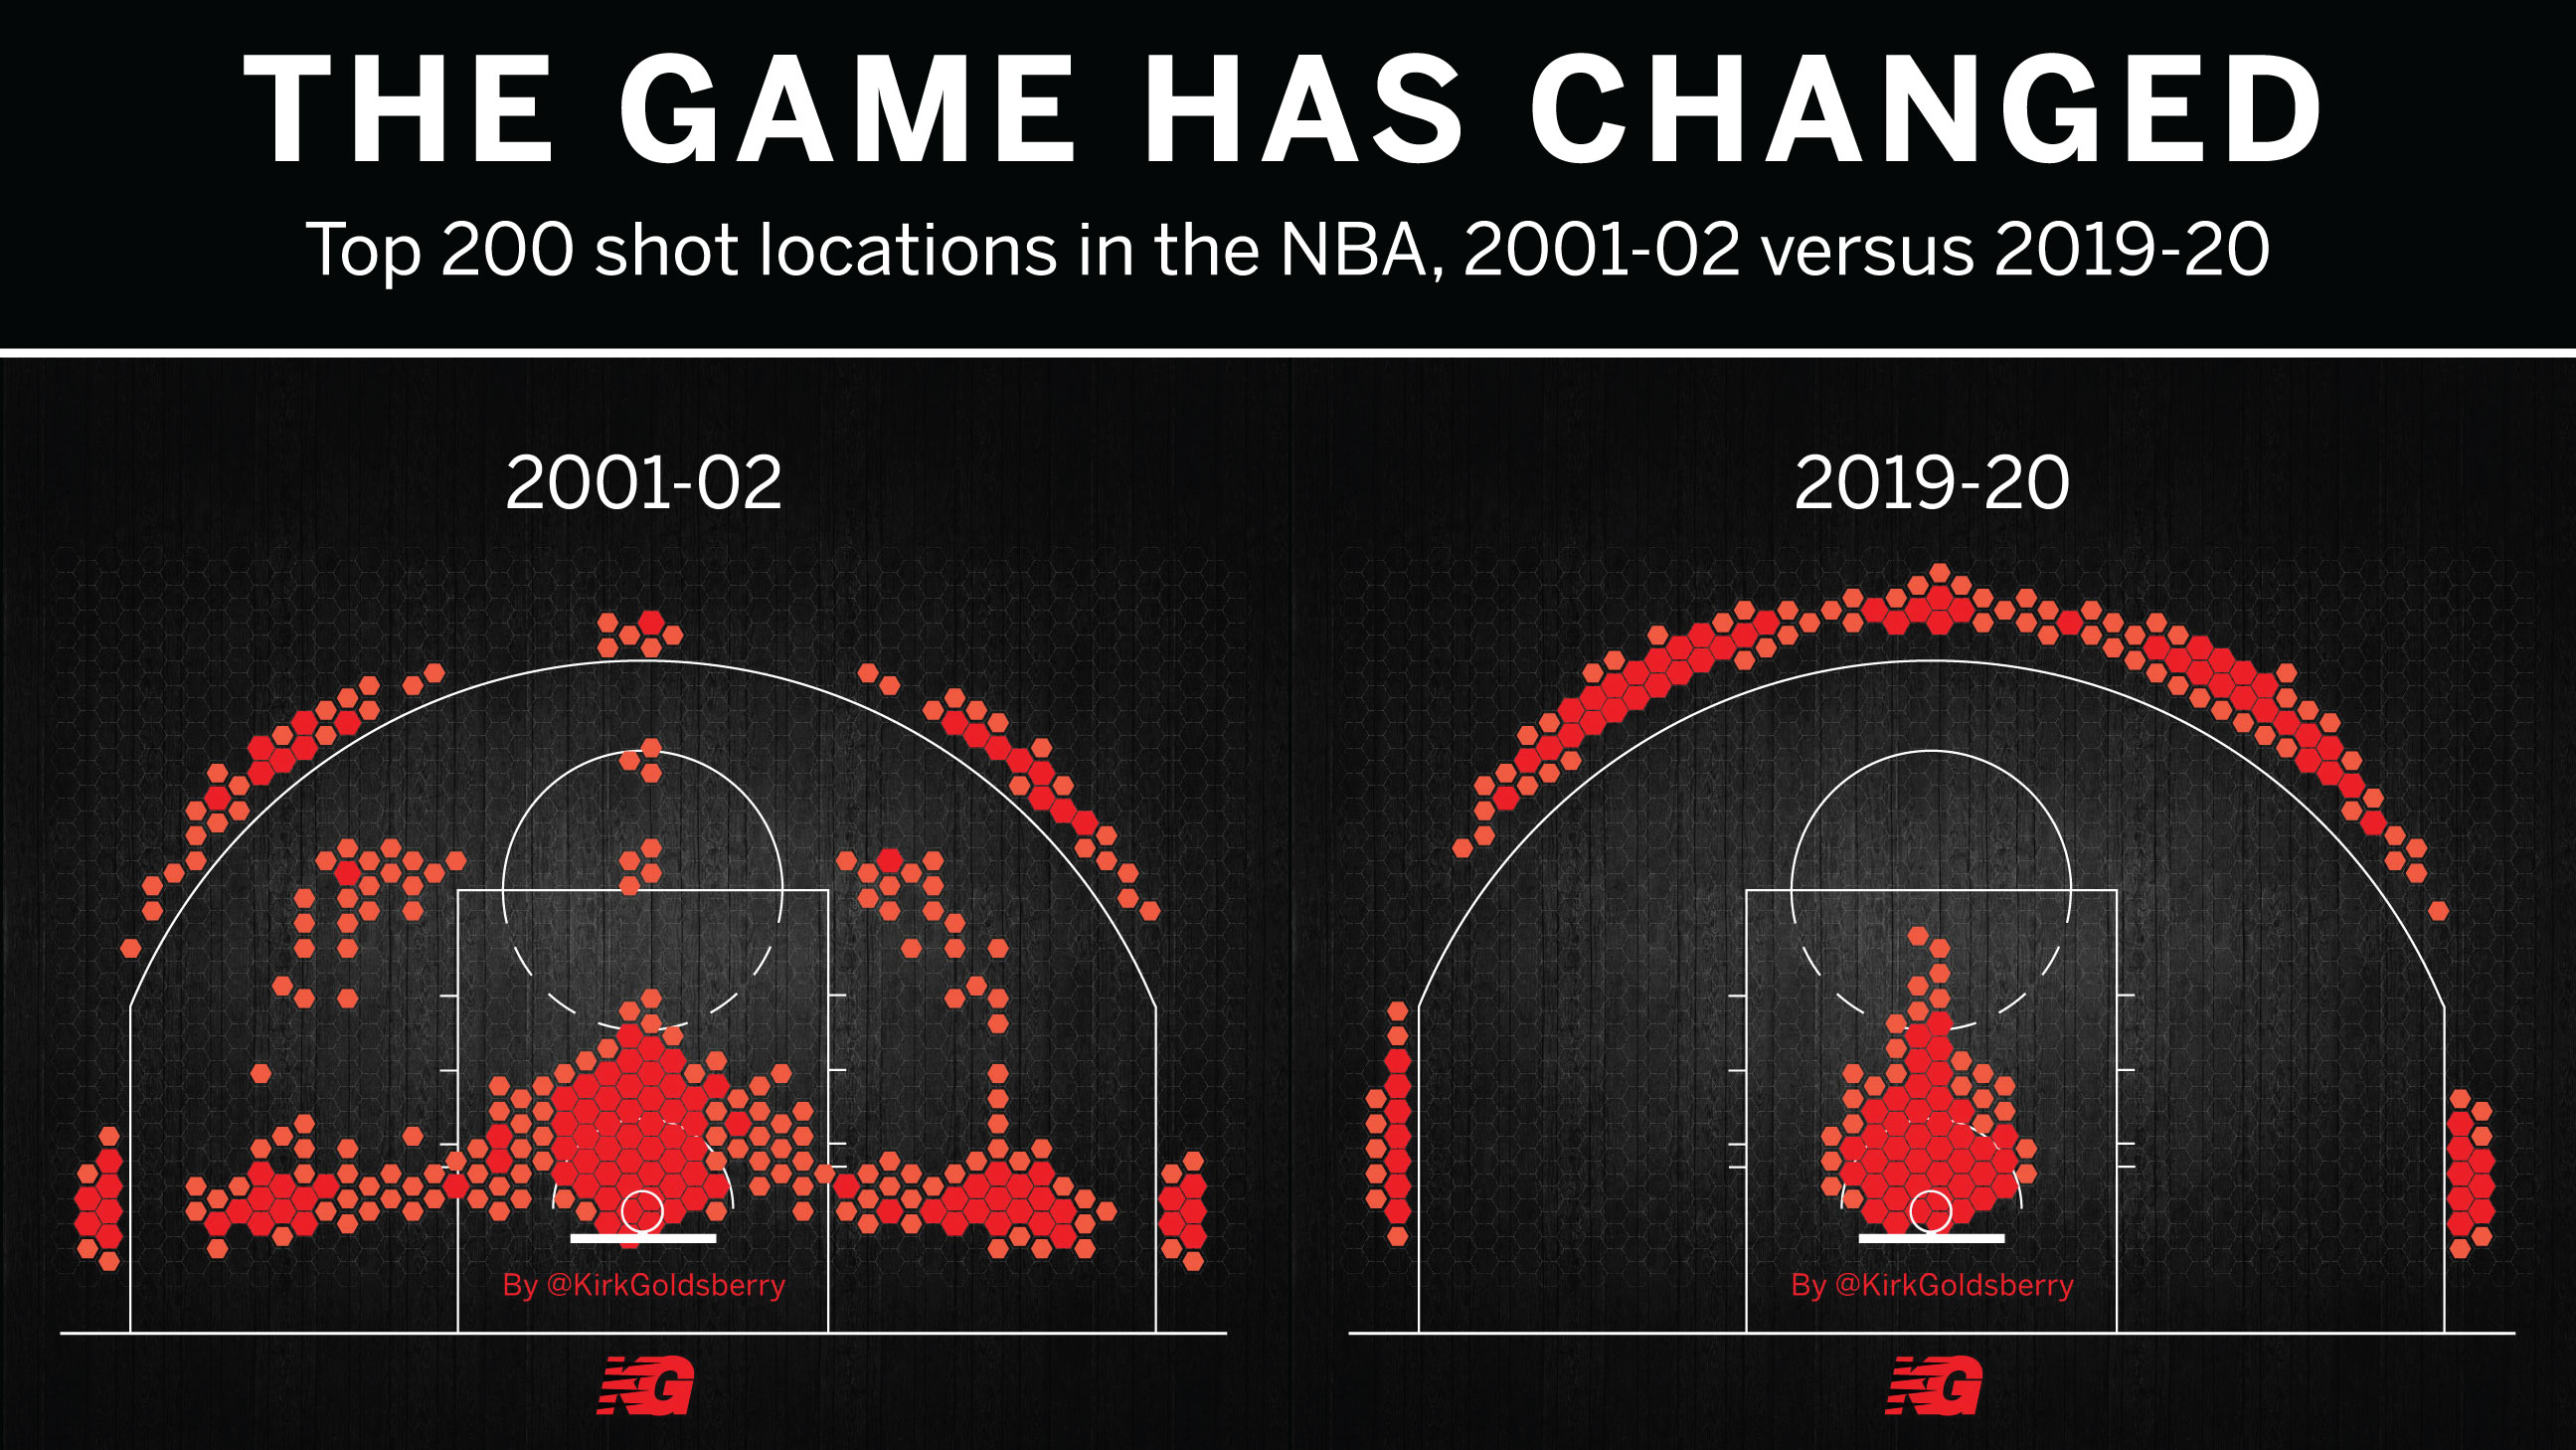
1st and 10 near the opponent's end zone? That's worth about 5 points. There's a chance to score the TD, a chance for the FG, and a chance for a turnover - and over thousands of games, we come to the average value of 5 points. The NBA too has seen a revolution based on expected points in the last 2 decades. Simply put, being close to the basket is better - unless you're shooting a shot worth 3 points instead of 2. People started doing the math and the game changed.
Each situation is reduced to how likely you are to score, given that situation. Using a variety of contextual factors, some basic regression, and a bunch of data, we're able to model for the 'expected value' of each and every situation a player might face.
So. How does EPA work in volleyball?
To get to expected points 'added' we need to first find the value of each situation in the game. This revolves around the following factors:
- Distance from the setter (how far off the net does the setter need to travel)
- Time between 1st and 2nd contact (proxy for height of pass/dig)
- Is the MB available and on a route?
- Number of blockers the attacker is facing
- If it's an overpass, does an opponent immediately attack? Or is it more of a freeball?
- Massey ranking of your opponent
Using all these different features, we can create models for every situation in the game.
Serving -
We start with a baseline expectation here given the strength of the team you're playing against. For example, if I'm serving against Nebraska, I need to know how often Nebraska typically wins the rally in general when they're receiving serve (let's say this is 65% of the time). From there, once I see the quality of their reception, I can value that reception in terms of 'expected points' - in this case, that's the same as 'expected sideout'. Let's say we force them to pass it high and the setter has to come out to the 15 foot line or so. We don't care about the specific attack that follows this specific reception, we only care about how often Nebraska typically scores from a high pass around 15 feet (maybe this is 60% of the time). To get EPA, we simply take the difference between the expectation before and after my serve. Before the serve, 65%. After the serve, 60%. Heck yeah! +0.05 EPA for me! This way we can isolate the value of the pass itself, removing what the setter / hitter actually do with afterwards.
Serve Receive -
This is basically the opposite of serving. Except we actually want to know how strong of a server I'm facing. In this case, we look at how each server individually has affected teams she has played before. Maybe this server is strong and teams only average about 60% expected sideout against her. But I get lucky and pass the ball absolutely perfectly. From this position, let's say my team has a 70% chance to win the rally against this opponent. So for EPA, same deal as before. Started with a 60% chance and gave my team a situation worth 70%. Boom! +0.10 EPA! I'm on fire.
Setting -
This is super tricky as setting is the closest thing our sport has to an art form. Keeping hitters in rhythm, delivering the right ball, at the right spot, to the right hitter is really challenging to wrap some models around given the data we have. I don't love my methodology (which is why I don't publish much setting related analysis) - but we take the quality of the 1st contact, let's say it's that perfect pass worth 70% - and then we also incorporate how many blockers I get for my attacker. In this case, I sling a great ball to my MB running a slide behind me and get her a 1 on 1 attack. We were already in a great position at 70%, but now with that opportunity against only 1 blocker, maybe that's worth 73%. Boom! That's another +0.03 EPA.
Attacking -
We start with the output value from the set, so we know we're perfectly in-system, with a 1 on 1 block. As we established, this situation itself has a value of 73% - and let's say I score the kill. I tool the line blocker and score. Well, naturally a kill = 100% chance to win the rally. So we take the same math as before, started with 73%, ended with 100% - so I get +0.27 EPA.
But let's say in a different world, the blocker gets the slowdown touch and allows for the libero to walk in and play an easy ball right to their setter. Well this is a huge problem for me now. I know that when the opponent is perfectly in-system with all their options, that situation means my team on defense only wins 25% of the time. Damn, no bueno! So I started with a 73% chance to win, but after my attack we're down to a 25% chance. That's -0.48 EPA. Oops...
Blocking -
Let's keep going with the example. The attacker I'm facing had a 73% chance to score given her situation. When we flip that around for the defense, a 73% chance is the same as a 27% chance for the defense. So the blocker starts at 27% before the attack. And ah ha! The blocker gets a great touch and creates a great situation for her offense. We said before this was worth 75% for the defense in transition (100% - 25% chance for the original attacking team). So here we start at 27% and our block touch gets us to 75%, excellent! That's +0.48 EPA for the blocker. That's actually a massive gain in value, in this case nearly 2x the value of getting the kill in the slide in the earlier example.
There's an additional tangent to address with blocking. What if players just consistently hit past you? You're the opposite and the other OH is just bouncing balls down the line and tagging your setter. In my opinion, you aren't lacking blame just because you didn't touch the ball - in fact it's likely the opposite. So we need to split the court into the responsibility of different blockers. So for every attack, we know if the attack was untouched, whose 'part' of the court it was attacked into. This will allow us to blame blockers who give up bounces - but also credit blockers who make a move that forces that attacker to play an easier shot.
Defense -
Like blocking, this is basically the opposite of attacking. But this is another skill that I find really tricky to evaluate given the current data we have. Another skill that can hopefully benefit through computer vision and player/ball tracking. The problem with the data here is that you only get credit for balls you touch - so a super active defender might touch everything, leading to her getting penalized. Without know exactly who is where, this is tough. I'd like to think about this like catch probabilities in baseball / football, but that's a bit down the road.
So... now what?
EPA style metrics can be helpful for player evaluation on your own team, evaluation in the transfer portal, scouting, training, etc. They can help provide color and context for live broadcasts and can help speak to the story after a match. The same way that many soccer commentators now routinely mention xG (expected goals) when recapping a game and highlighting which team 'played' better. These types of metrics have also spurred on other changes: more 3s and dunks in the NBA, the shift / more HRs / more strikeouts in the MLB, more aggression on 4th down in the NFL, and many others.
To be clear, these models aren't perfect, nor am I. I make mistakes with my charts, I make mistakes with my code. But I still think helping to push EPA in our sport is a worthy cause - as the analytical side of the game is just one part of our sport that is stuck in the past. With a big push for increased TV and media presence for volleyball here in 2024, hopefully we can keep pushing from a data perspective as well and catch up with some of the other pro sports around the world.