
If you haven't noticed, big Moneyball guy over here.
Our issue here is not that there are rich teams and there are poor teams - but it's that we fail to evaluate Reception in reality.
We use metrics like Passer Rating because we think it's a good proxy for passing performance. To it's credit, it's a great proxy for how often you pass well. But I am here today to persuade you that passing well is not the point - the key is to not pass poorly.
And while you might be thinking, yeah no kidding...
I submit for your consideration: Expected Sideout
What passer ratings do is over-index on the good stuff, but seriously under-value the errors. I'll show you what I mean.
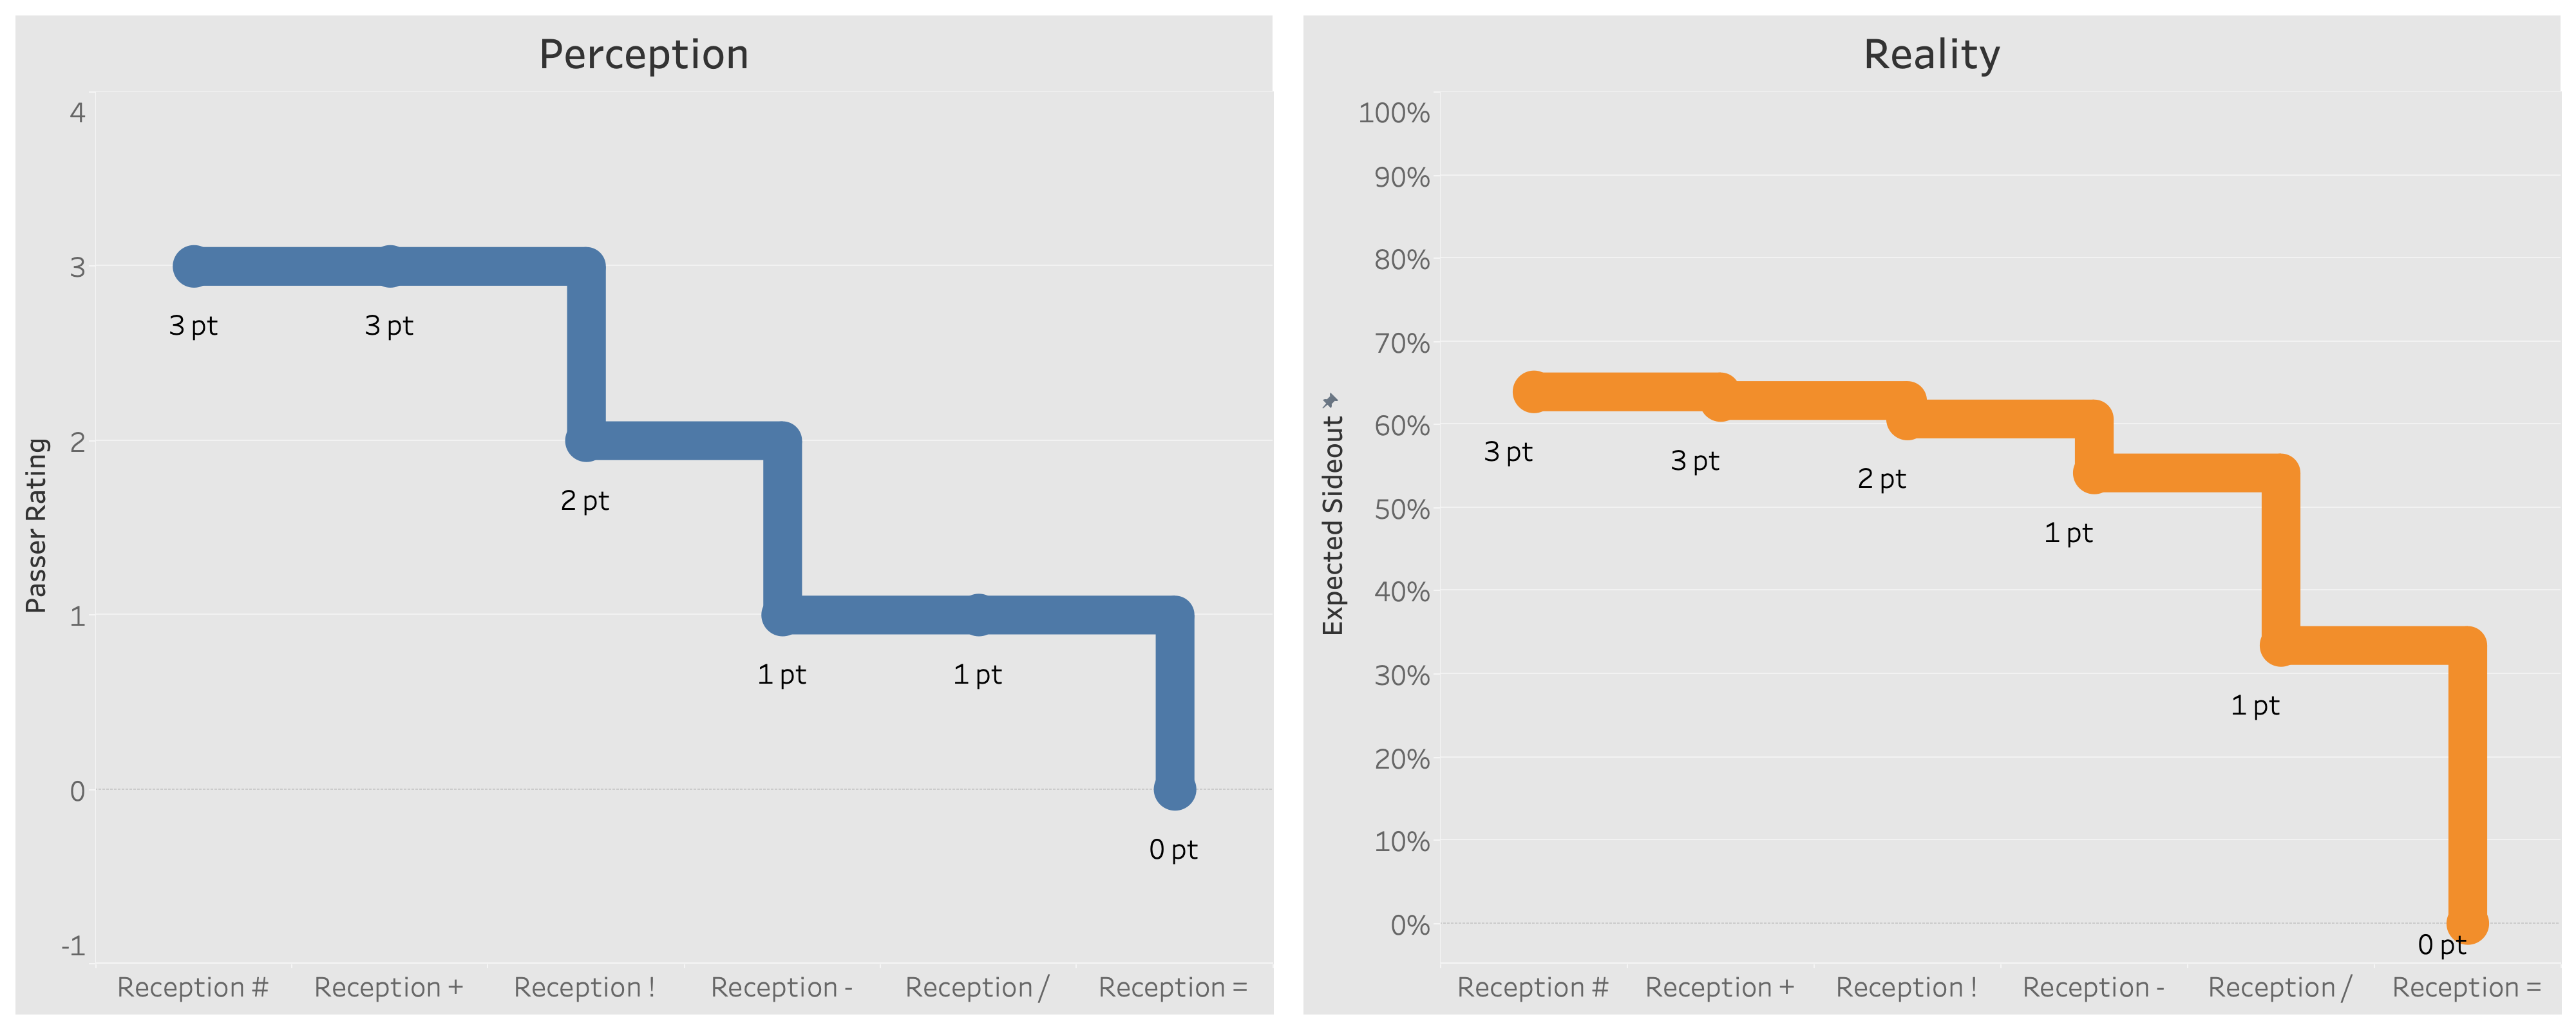
So the issue is that passer ratings assume each outcome is equidistant from the next.
3-2 = 2-1 = 1-0 and that 3-1 = 2-0.
In coaching terms, your player could pass 2, 2, 1, 1 or 3, 3, 0, 0 and both would be a 1.5 passer rating.
This doesn't pass the eye test.
Hypothetical - Two Passers
They'll both get 10 serves, with both passing a 1.5 passer rating
Player A: 3, 3, 3, 3, 3, 0, 0, 0, 0, 0 = 1.5 passer rating
Player B: 2, 2, 2, 2, 2, 1, 1, 1, 1, 1 = 1.5 passer rating
But what if we use reality, instead passer ratings?
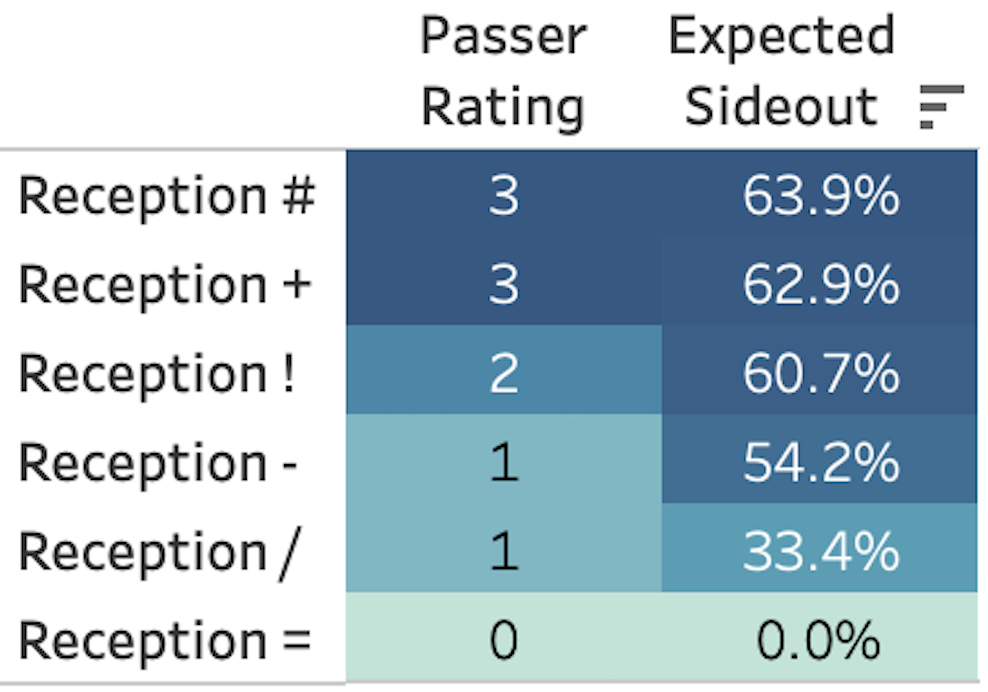
Player A: 63.9, 63.9, 63.9, 63.9, 63.9, 0, 0, 0, 0, 0 = 32% Expected Sideout
Player B: 60.7, 60.7, 60.7, 60.7, 60.7, 54.2, 54.2, 54.2, 54.2, 54.2 = 57% Expected Sideout
Same 10 balls, huge difference.
Reception Error drives the difference.
I turn now to exhibit B, teams from the 2022 NCAA Women's season.
How does their Expected Sideout change as Reception Error increases?
Quite a bit seems to be the answer.
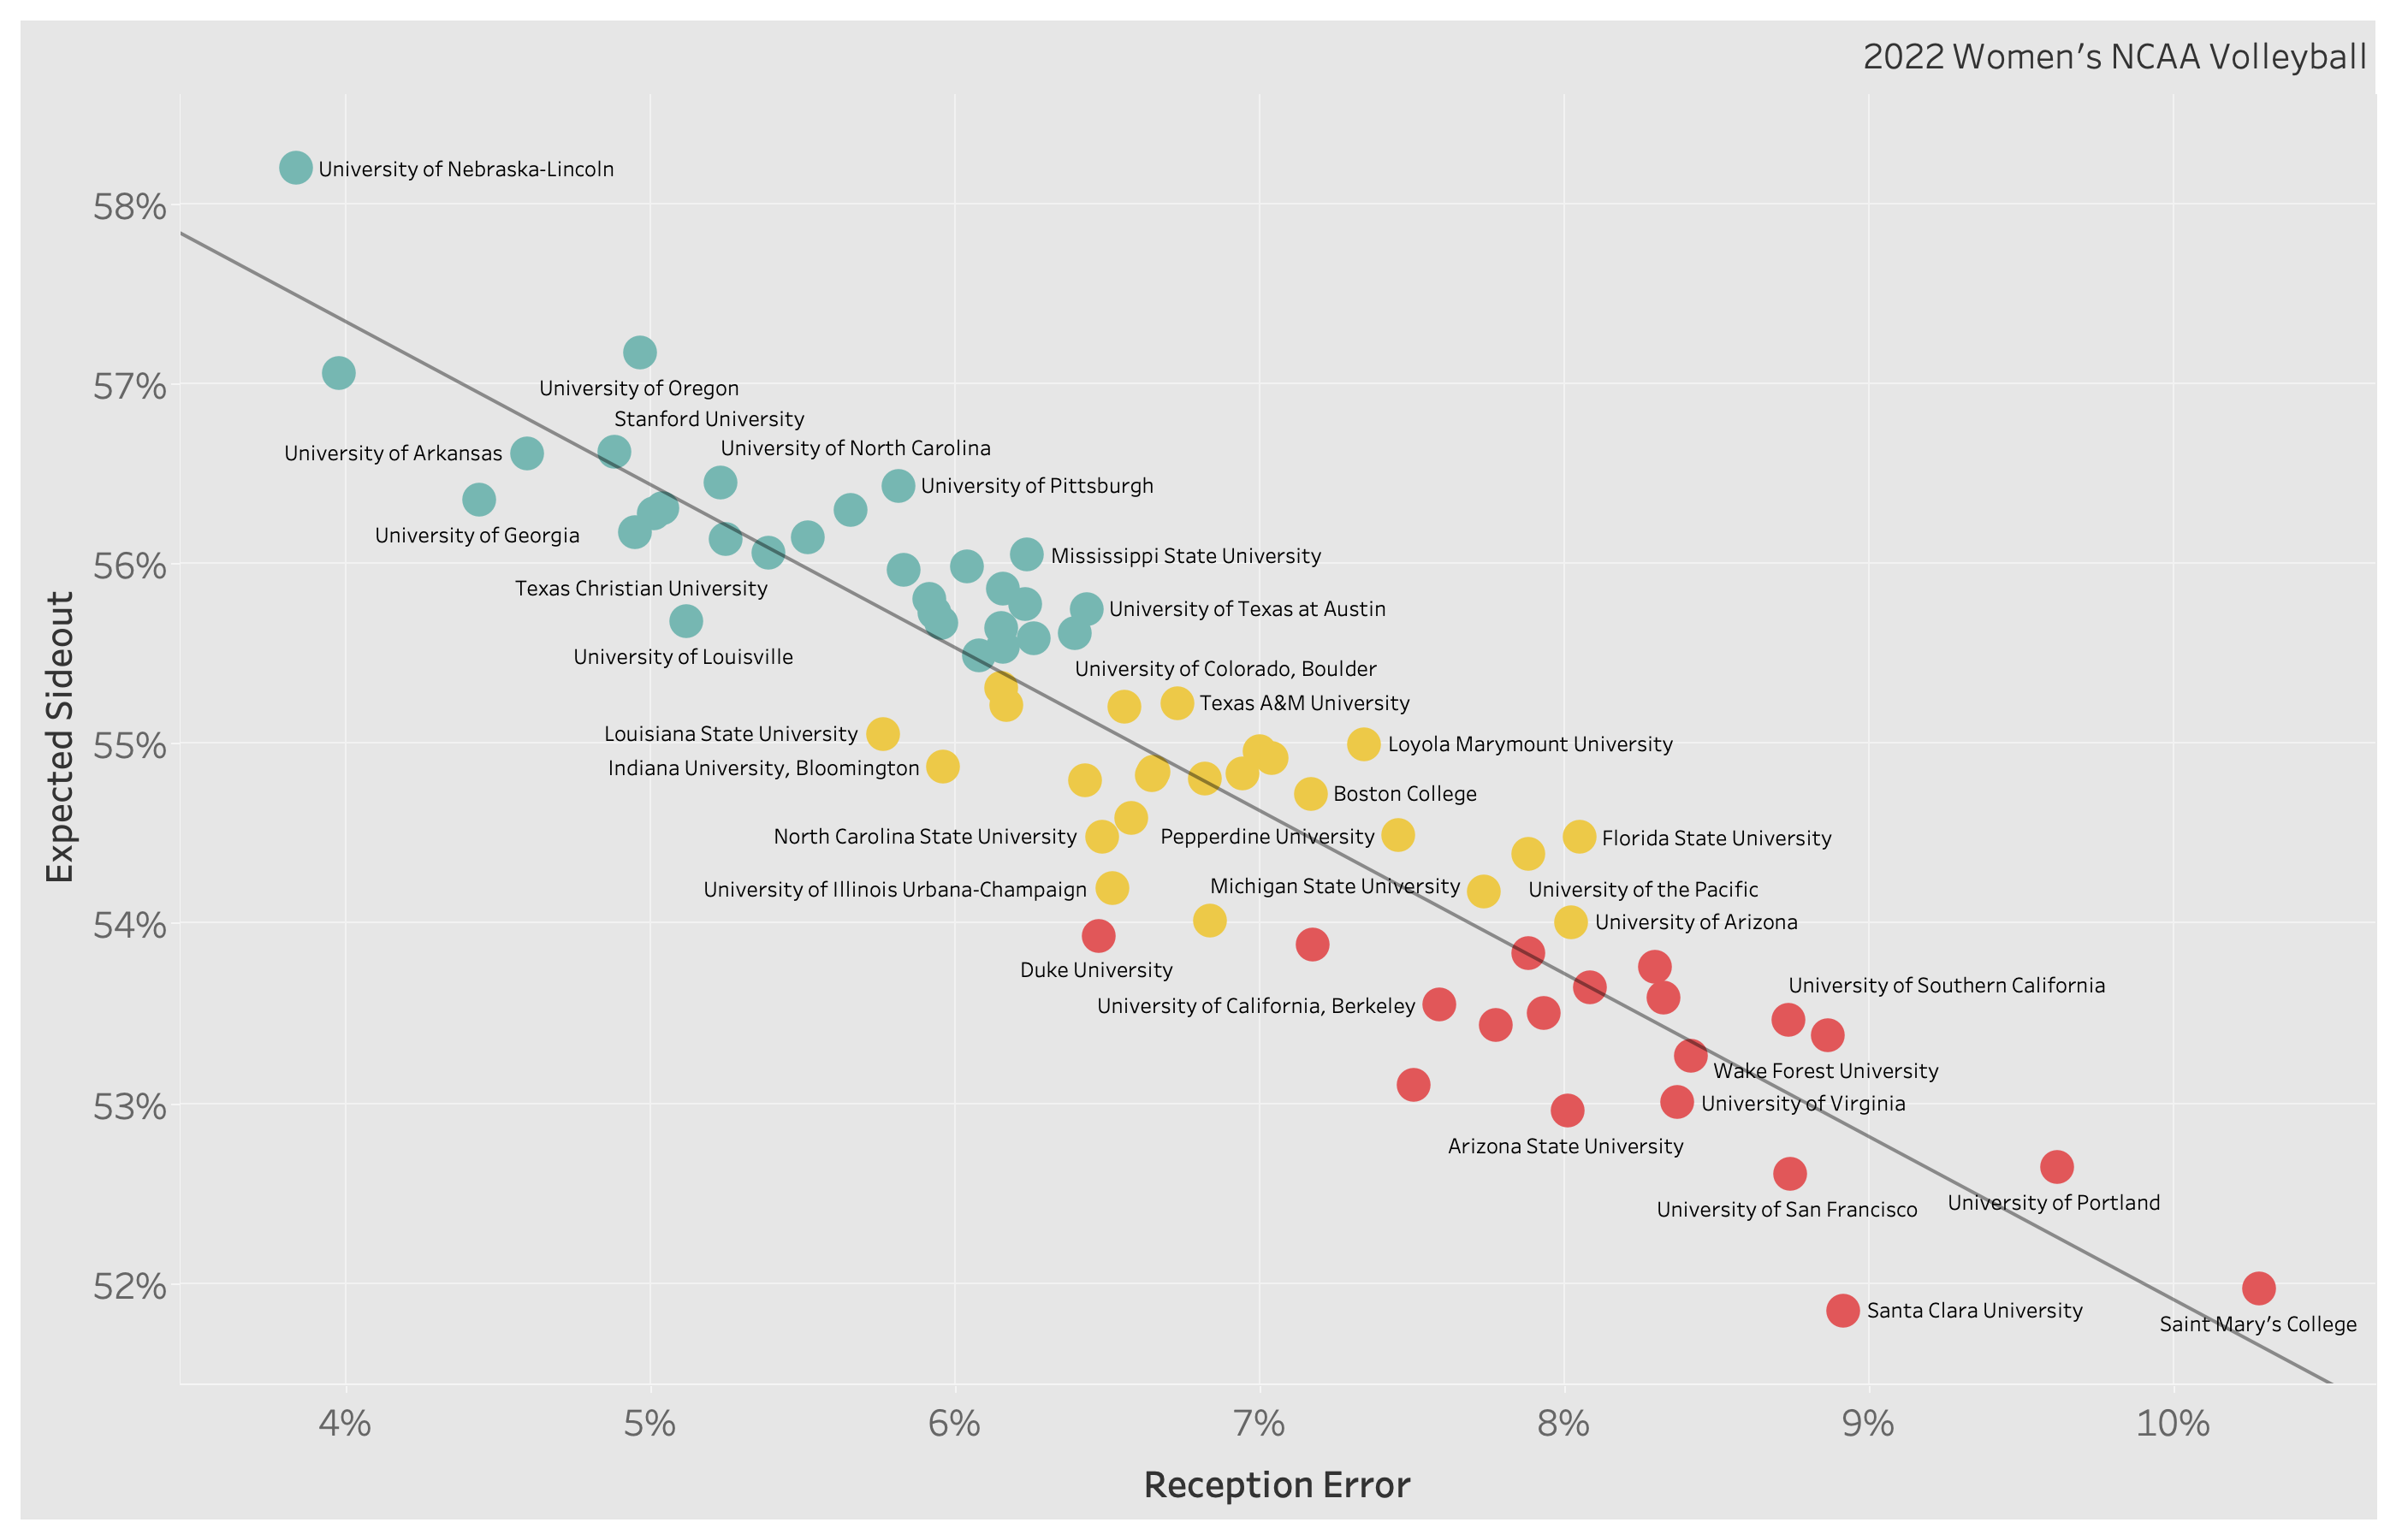
For those playing along at home, the R2 = 0.86. Meaning that 86% of the change in Expected Sideout is explained by Reception Error %.
Your Honor, I rest my case.
While the secret to passing is obviously: the shuffle step (@DannyKinda)